Posts

Reflections

Stewardship of Masonville Cove Technology has changed the game for many industries including conservation. In order to effectively steward an area we must use all the tools available to us to collect, monitor and enhance the data we can obtain for conservation purposes. This semester I learned about several new sources for information and perspectives to consider when stewarding a site for biodiversity. From using new and different mapping tools for soil quality and what that means for a site, to analyzing the vegetation and biota diversity. Sometimes it is important to take a step back to look at the big picture to understand the small view of a site you may see in person. This semester also reminded me how to break down these complex issues of biodiversity and conservation into simpler terms for people who may not be as familiar with complex systems.  Masonville Cove is managed and worked on by several stakeholders meaning communication is essential to work being achieved here. Havin
Shazam for Nature

Image
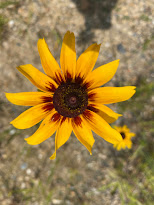
Seek by iNaturalist The species identification app that iNaturalist has added to the market has been dubbed the Shazam for nature app. The app features live image recognition that draws from a massive database of information before even taking the photo. Once you take the picture it further analyzes its contents for better identification.  When opening the camera in the app and viewing a species it will quickly go through the taxonomic ranks of identification till it gets down to species. In some cases it has trouble identifying the species so it will give you the genus and species options that can help you identify it more specifically. If the app is having trouble identifying the species you can move the camera around to other angles to get more accurate images for identification. Once you make an accurate identification it pulls up a summary page of the organism. From here you can view more pictures, determine whether it's native or non-native, information about the species, a r

Using Web Soil Survey- USDA

Image
While listening to the tutorial and playing with the Web Soil Survey I was able to discover many helpful tools and capabilities of the map. You can tell this was created by someone who has used other platforms before and had very specific things they wanted to make sure it could do to make the users life easier. Having used several mapping platforms and natural resources based maps before, as well as trying to integrate other tools with each other this program is well thought out. Some of the properties I found most helpful from a basic user point of view: link- very helpful if you are working on a project and want to be able to reopen the same extents exporting to a different platform  navigating map and extents is relatively easy with only a basic explanation necessary Looking at this program from the point of view of someone who would use this for a study or in depth analysis the things I found interesting and helpful were: description of soil types and delineations are clear and pr

Climate Resources

Looking at various climate and weather predication sources I have found that many of them rely of different climate models and current weather events to analyze climate over time. The NOAA and National Weather service storm prediction center site  is easy to understand and use. Many times the maps are difficult to understand what the data is showing you. These maps are clear and even show you when it was last updated, often showing live data.  I found the NOAA Climate Data Online  to be slightly more complicated. While trying to look at the maps and pull up the location I wanted to see the data it is showing is not exactly explicit or clear. Despite the maps being somewhat hard to digest the other options such as the Tool Search or Data Tool selection must be ordered in data sets and are not exactly accessible to the average person.  Additionally I found this interactive map from USGS  that I found to be the most accessible, and understandable. The user can adjust the location of focus

Masonville Cove - MyMap

                                           MyMap Using the MyMap program was simple, easy and understandable for a novice user. The program is easy to navigate and access for people who often use Google programs. The MyMap program could be very useful when displaying environmental sites in an effective and interactive way. Some of the different capabilities it has that I thought would be useful when doing a biodiversity study of the Masonville Cove are as follows:  different layers to show different species sitings or known locations, or for different wetlands/ locations within the environmental area various colored labels for different types of animals such as birds, amphibians, reptiles, fish easy to navigate and learn how to use create polygons to define certain areas for visual understanding ability to import to websites and export to KML files to upload to other programs such as ArcGIS add links, pictures and videos to specific points for better visual impact and understanding

Intro to Ecology

Slides

What is Biodiversity?

My definition of biodiversity is as follows: Biodiversity is the collection of various flora and fauna that can reveal the health of an ecosystem based on the number and types of species present. It can be measured on various levels from small micro-ecosystems to the entire world. Biodiversity has three levels species diversity, genetic diversity and ecosystem diversity. Within these three levels we can break down diversity even further. Looking into genetic diversity, ecological succession and functionality. Biodiversity is such a general concept that has an almost unlimited amount of factors that play into its measurements it makes it difficult to summarize in two sentences.